Detention and Demurrage Optimization Movement UI
Overview
The Movement UI provides enhanced visualization capabilities for Detention and Demurrage Optimization shipments, displaying:
- Real-time cost status and container availability
- Cost tracking dashboards with detention and demurrage calculations
- Historical cost dashboards and contact details
- Alerts on risk of container moving into different cost tier at Terminal and cost escalation alerts
Key Features
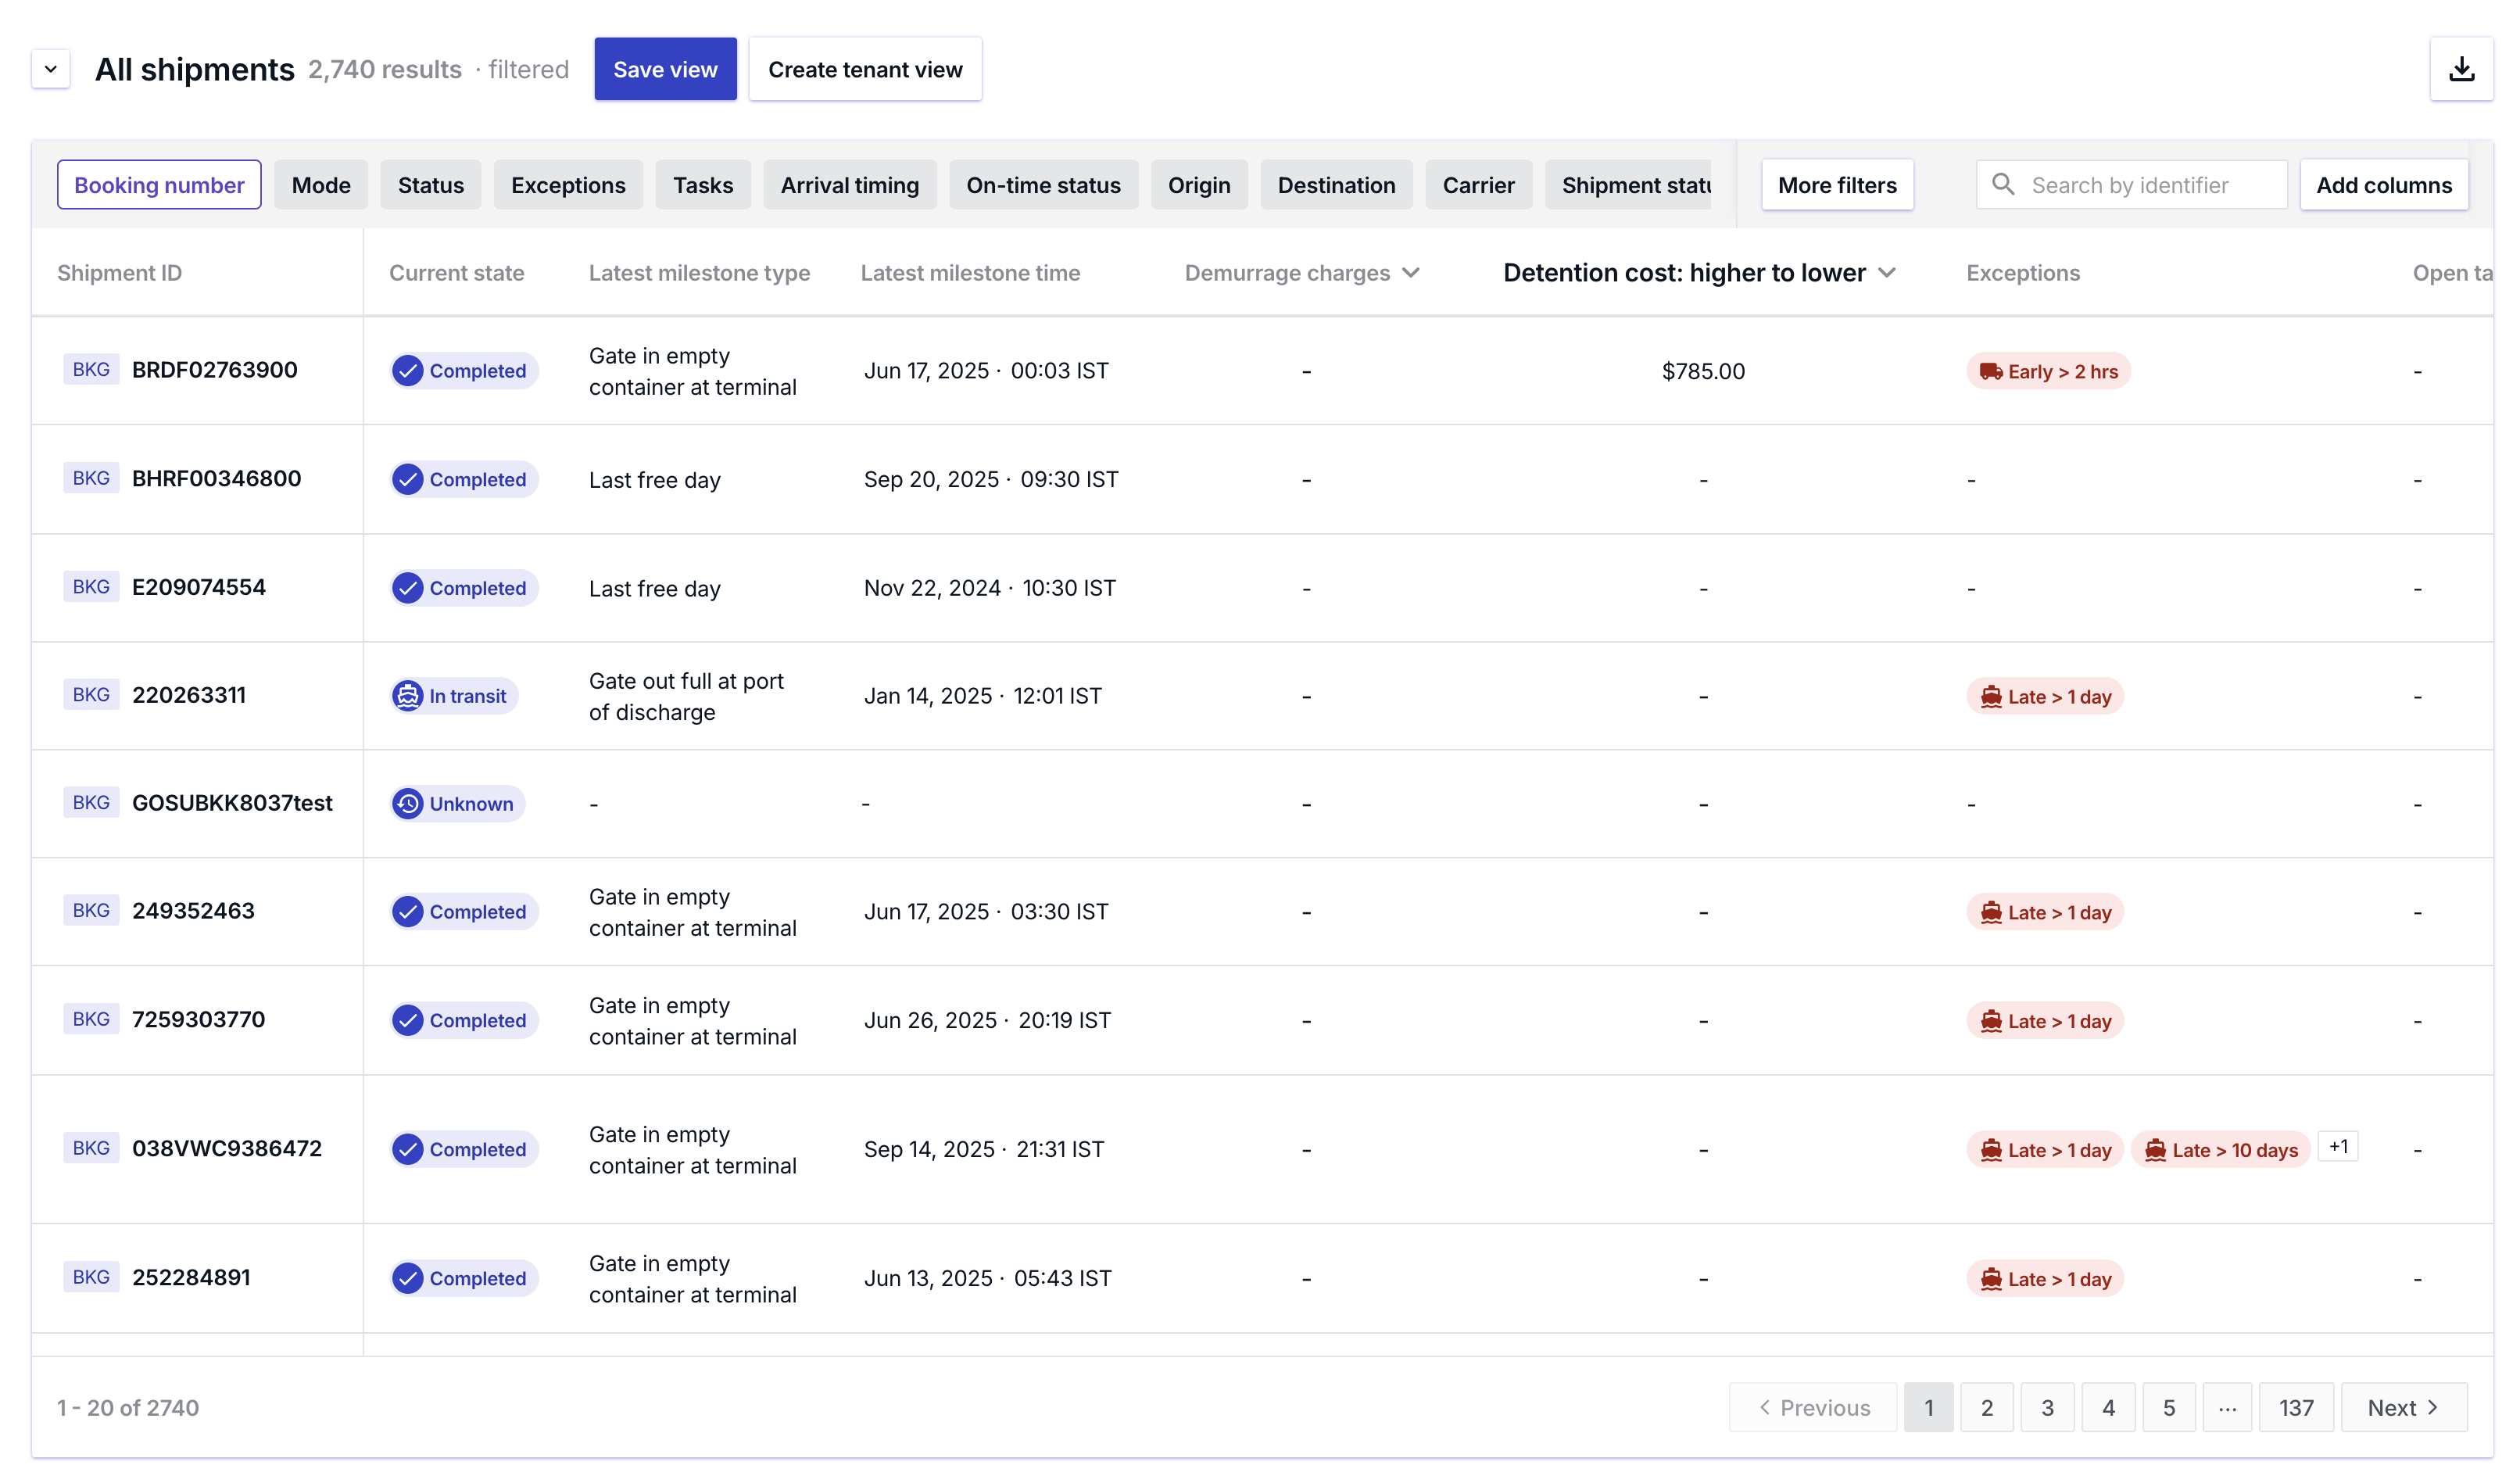
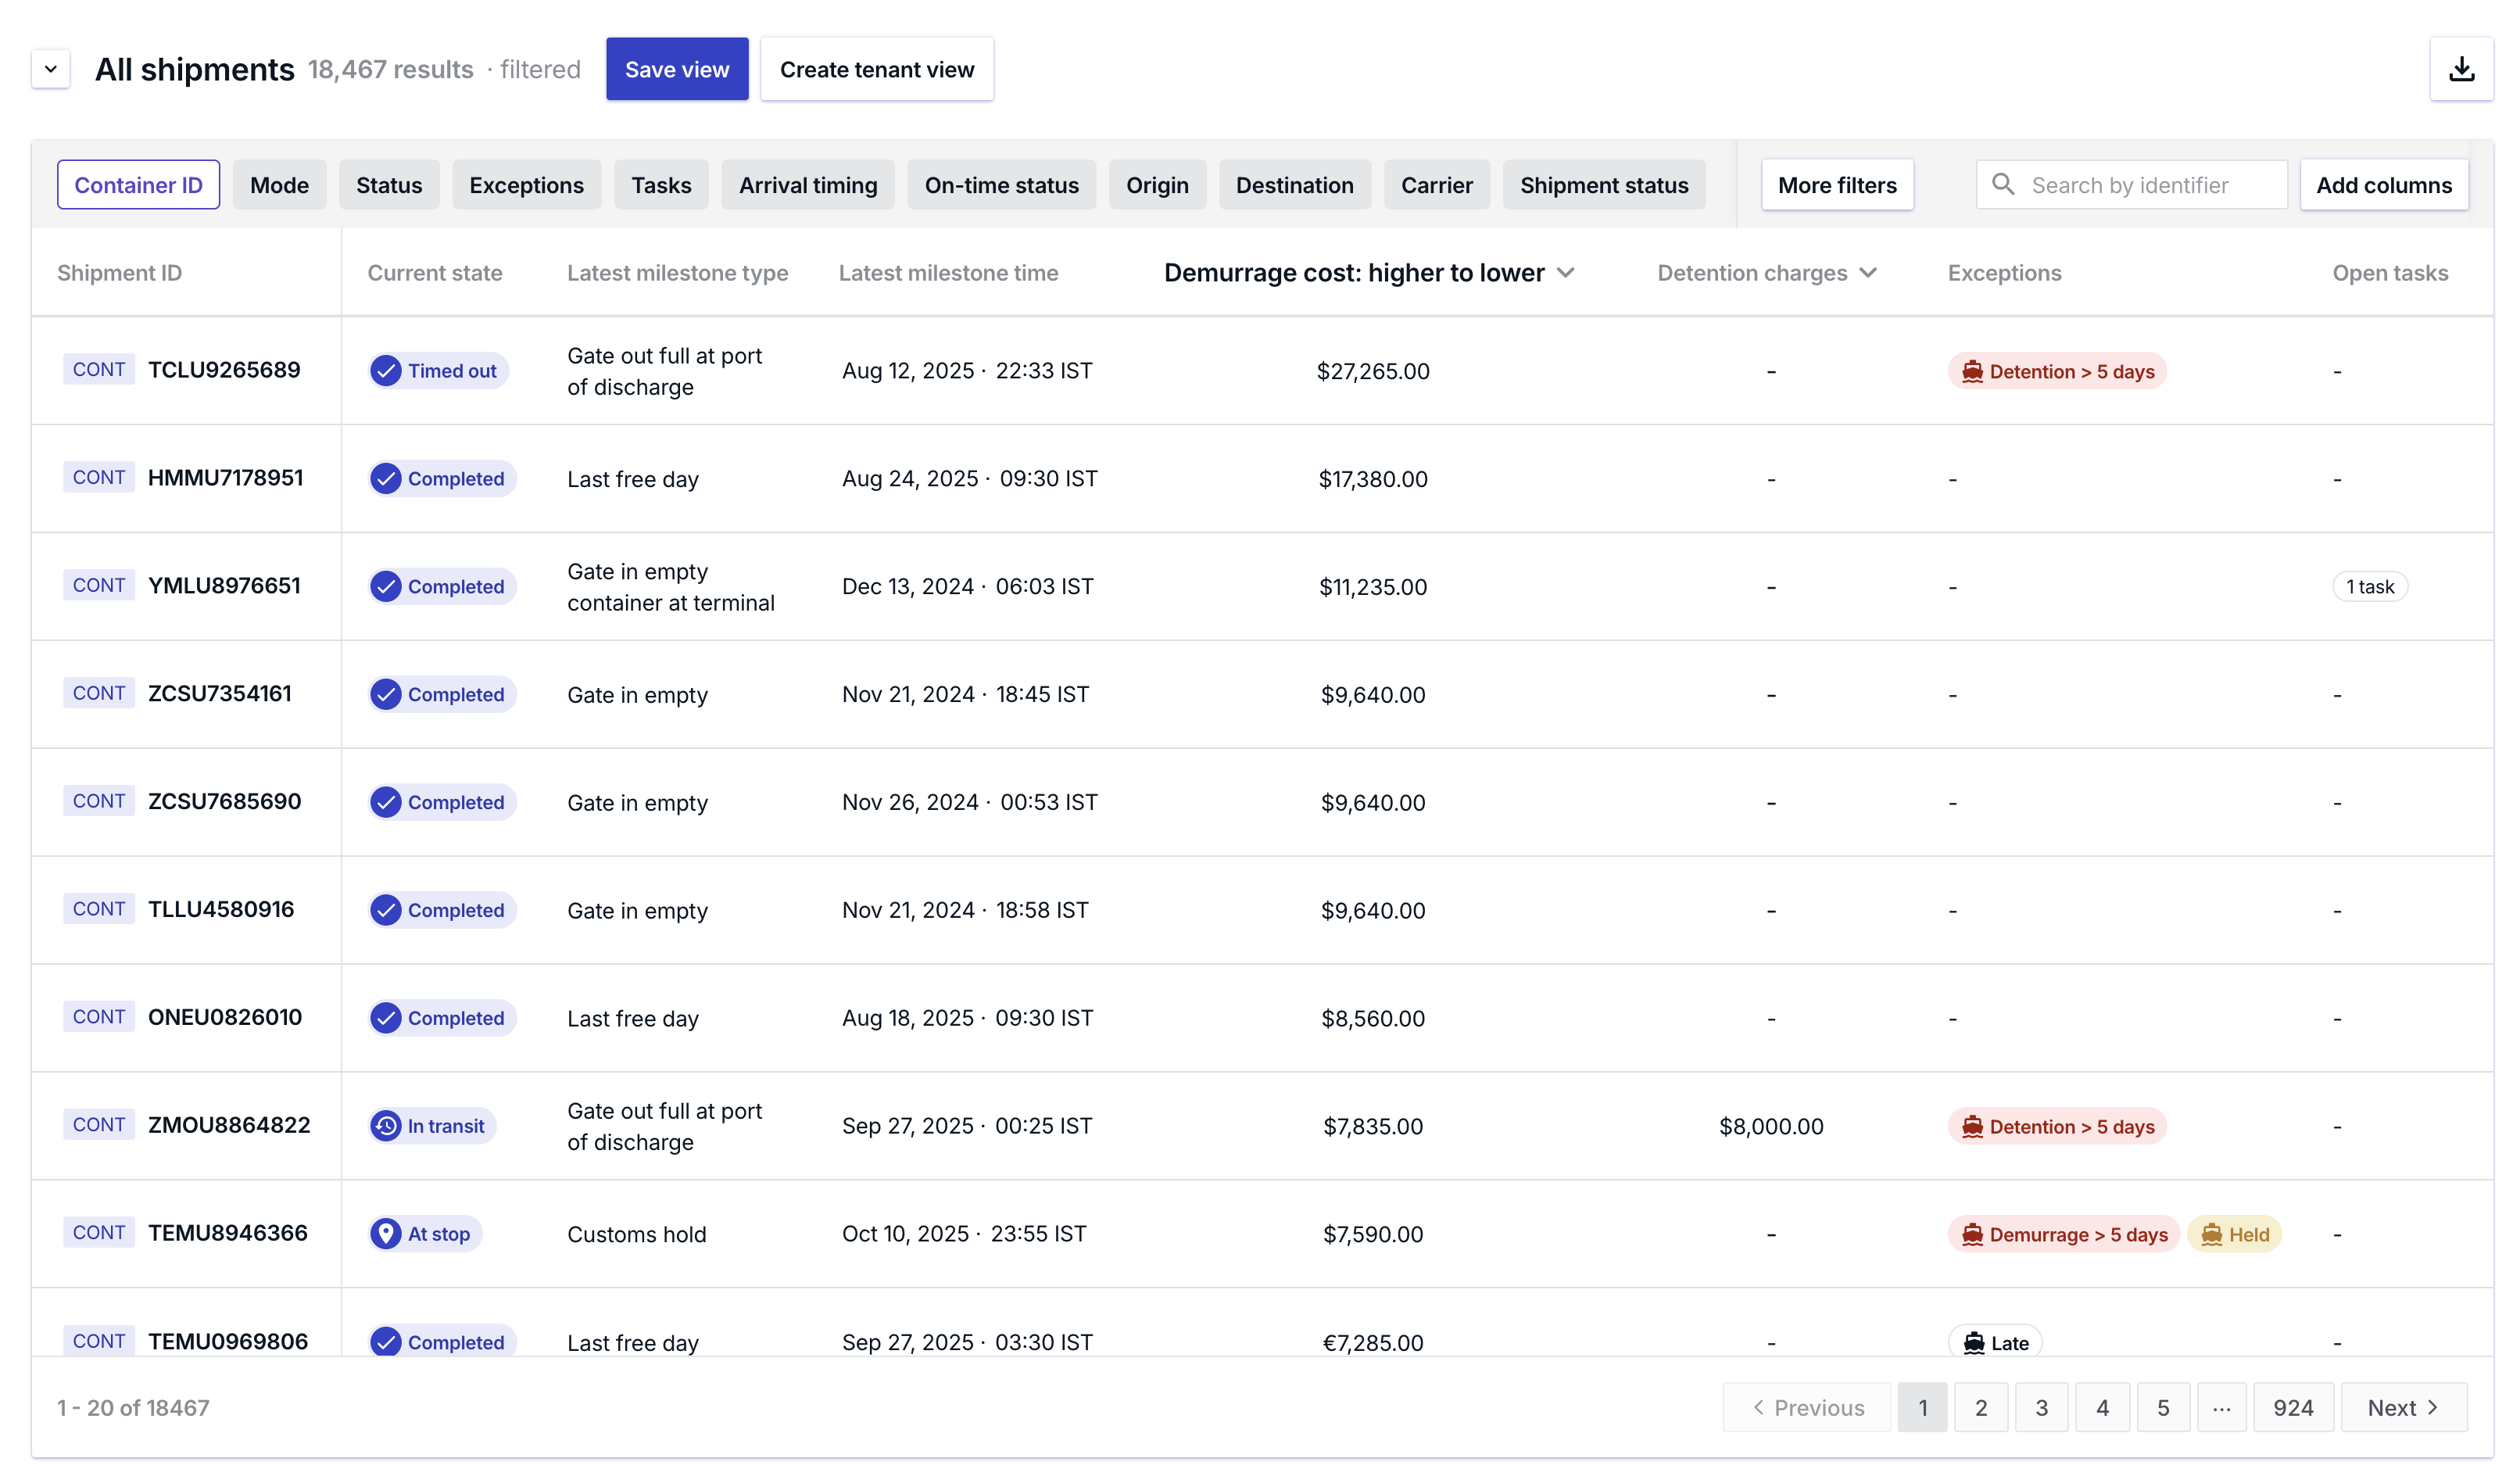
Enhanced Shipment View
The existing shipment view page now includes dedicated demurrage and detention cost columns, providing immediate cost visibility for all containers.
Container-Level Cost Breakdown
Individual container tracking pages feature complete cost computation breakdown, showing detailed calculations for:
- Daily demurrage/detention charges
- Accumulated costs over time
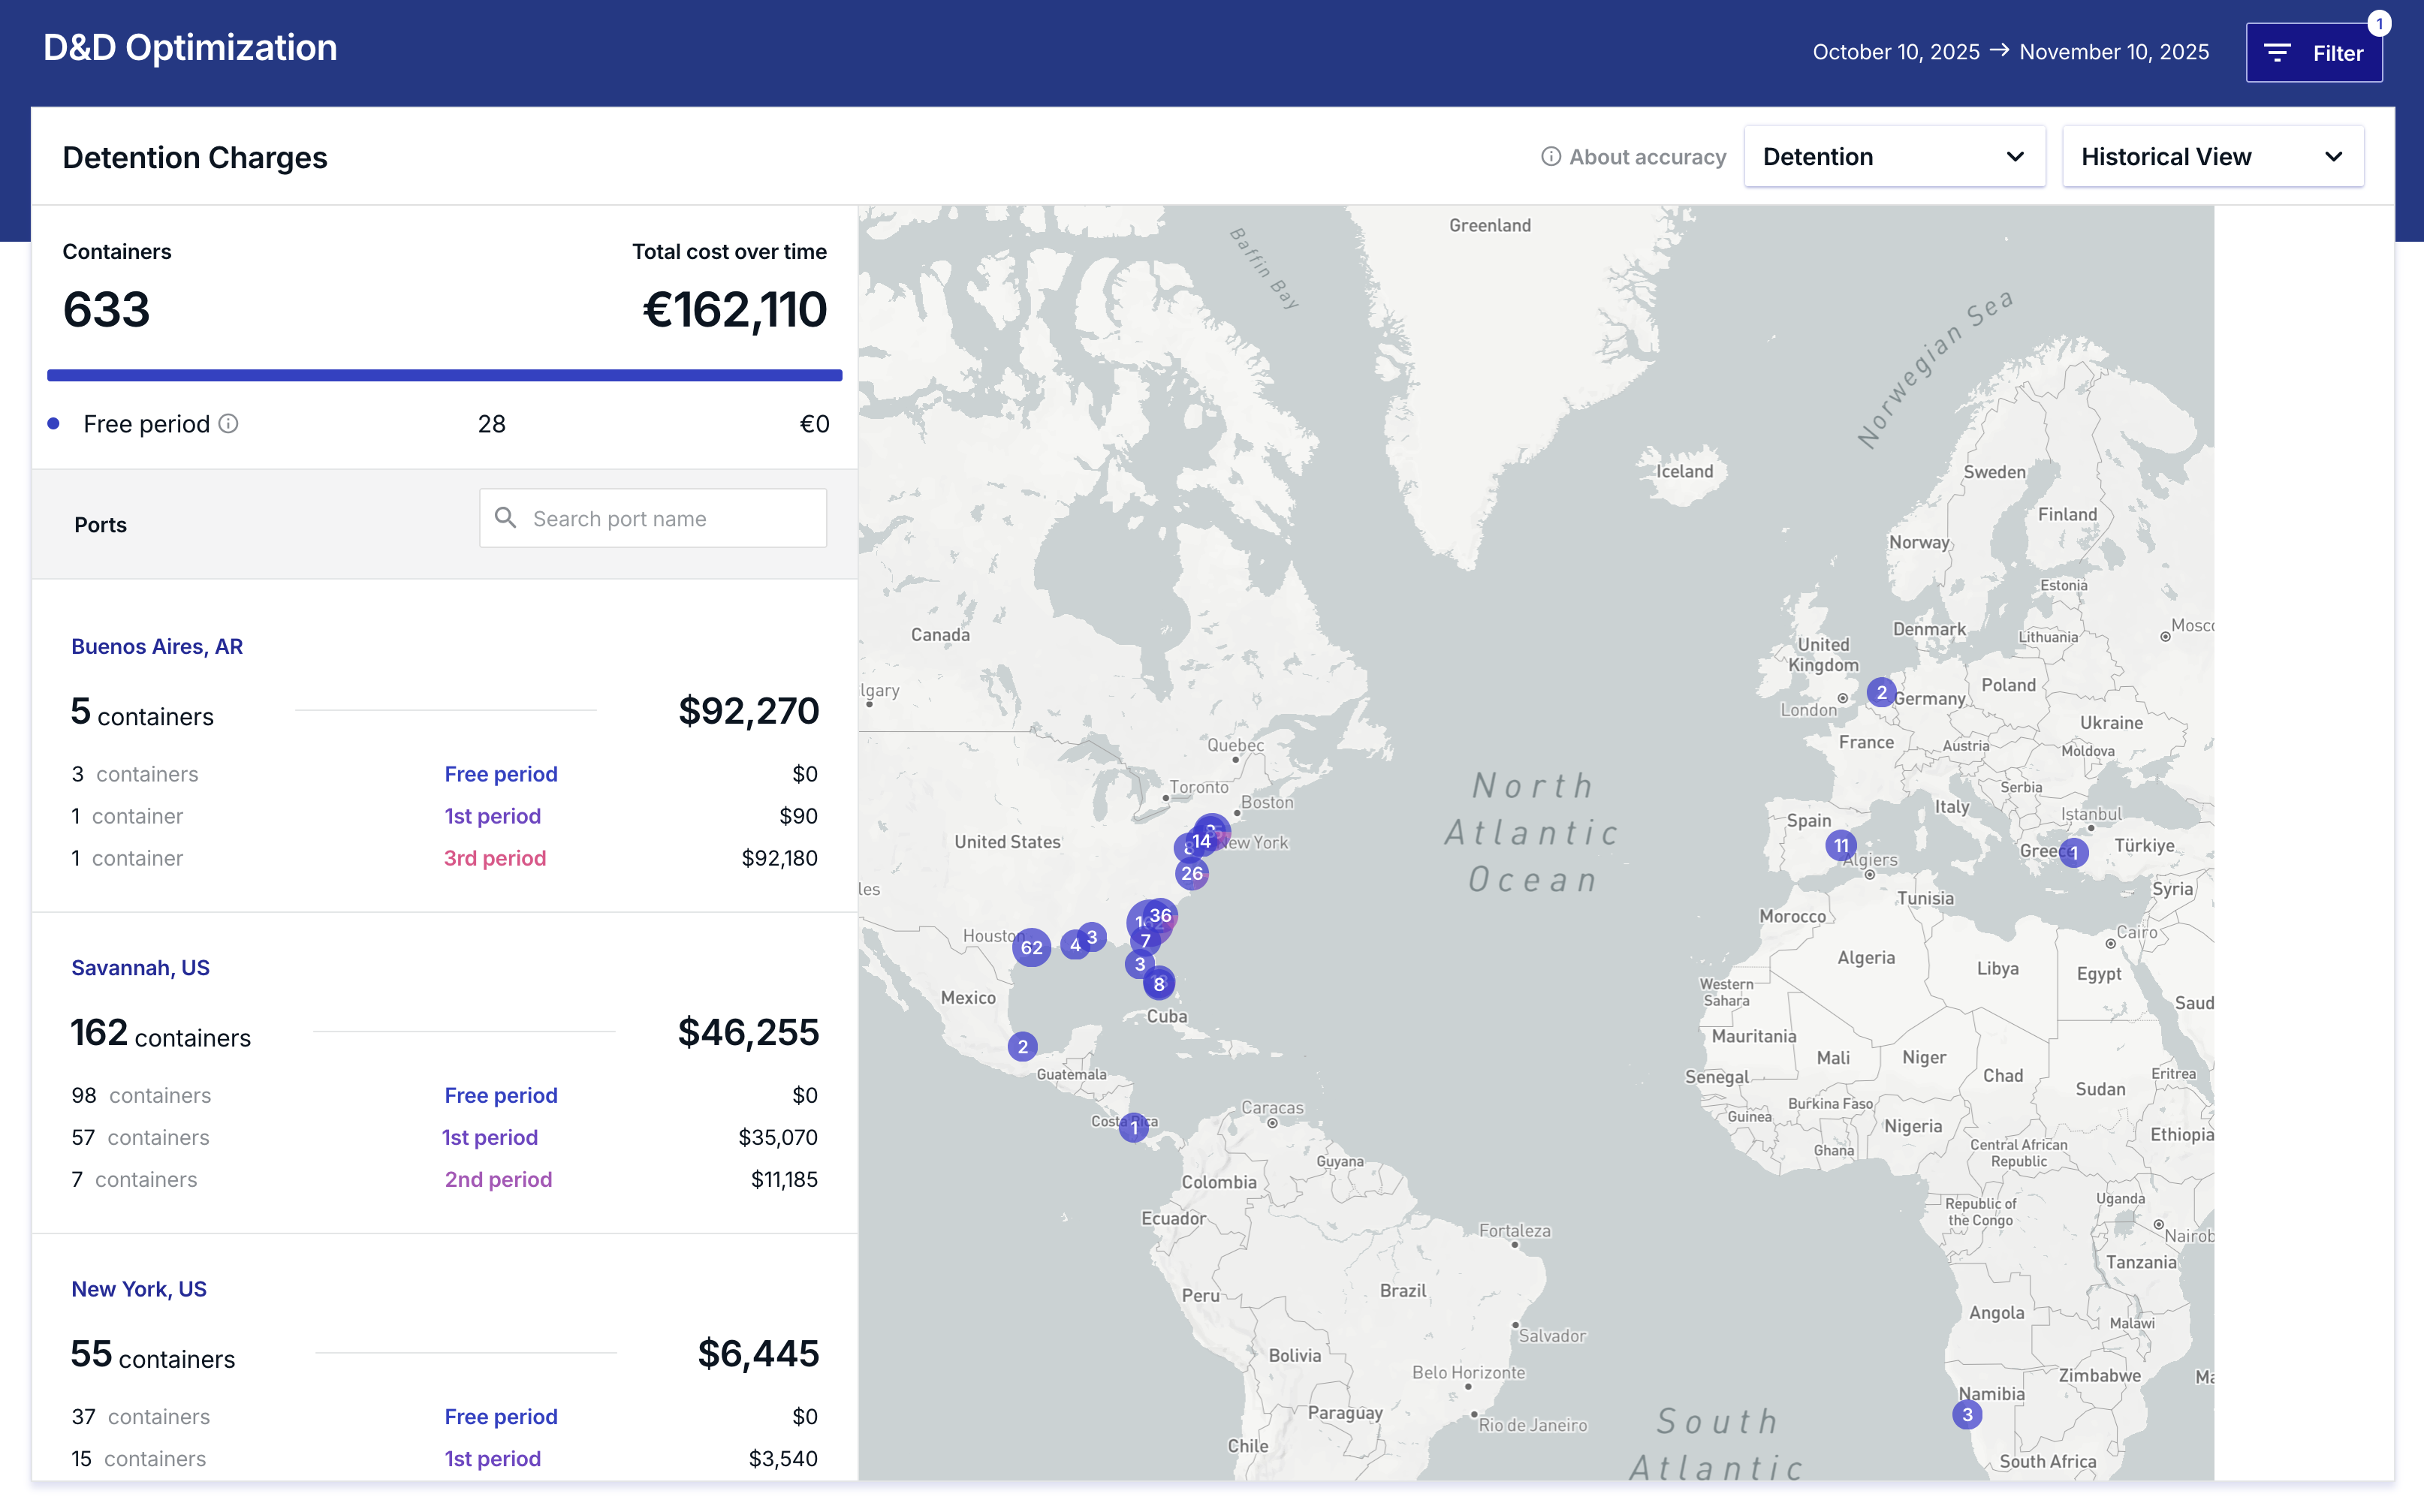
Detention and Demurrage Analytics Dashboard
Comprehensive analytics dashboard providing insights into active and historical demurrage and detention costs at terminal levels, featuring:
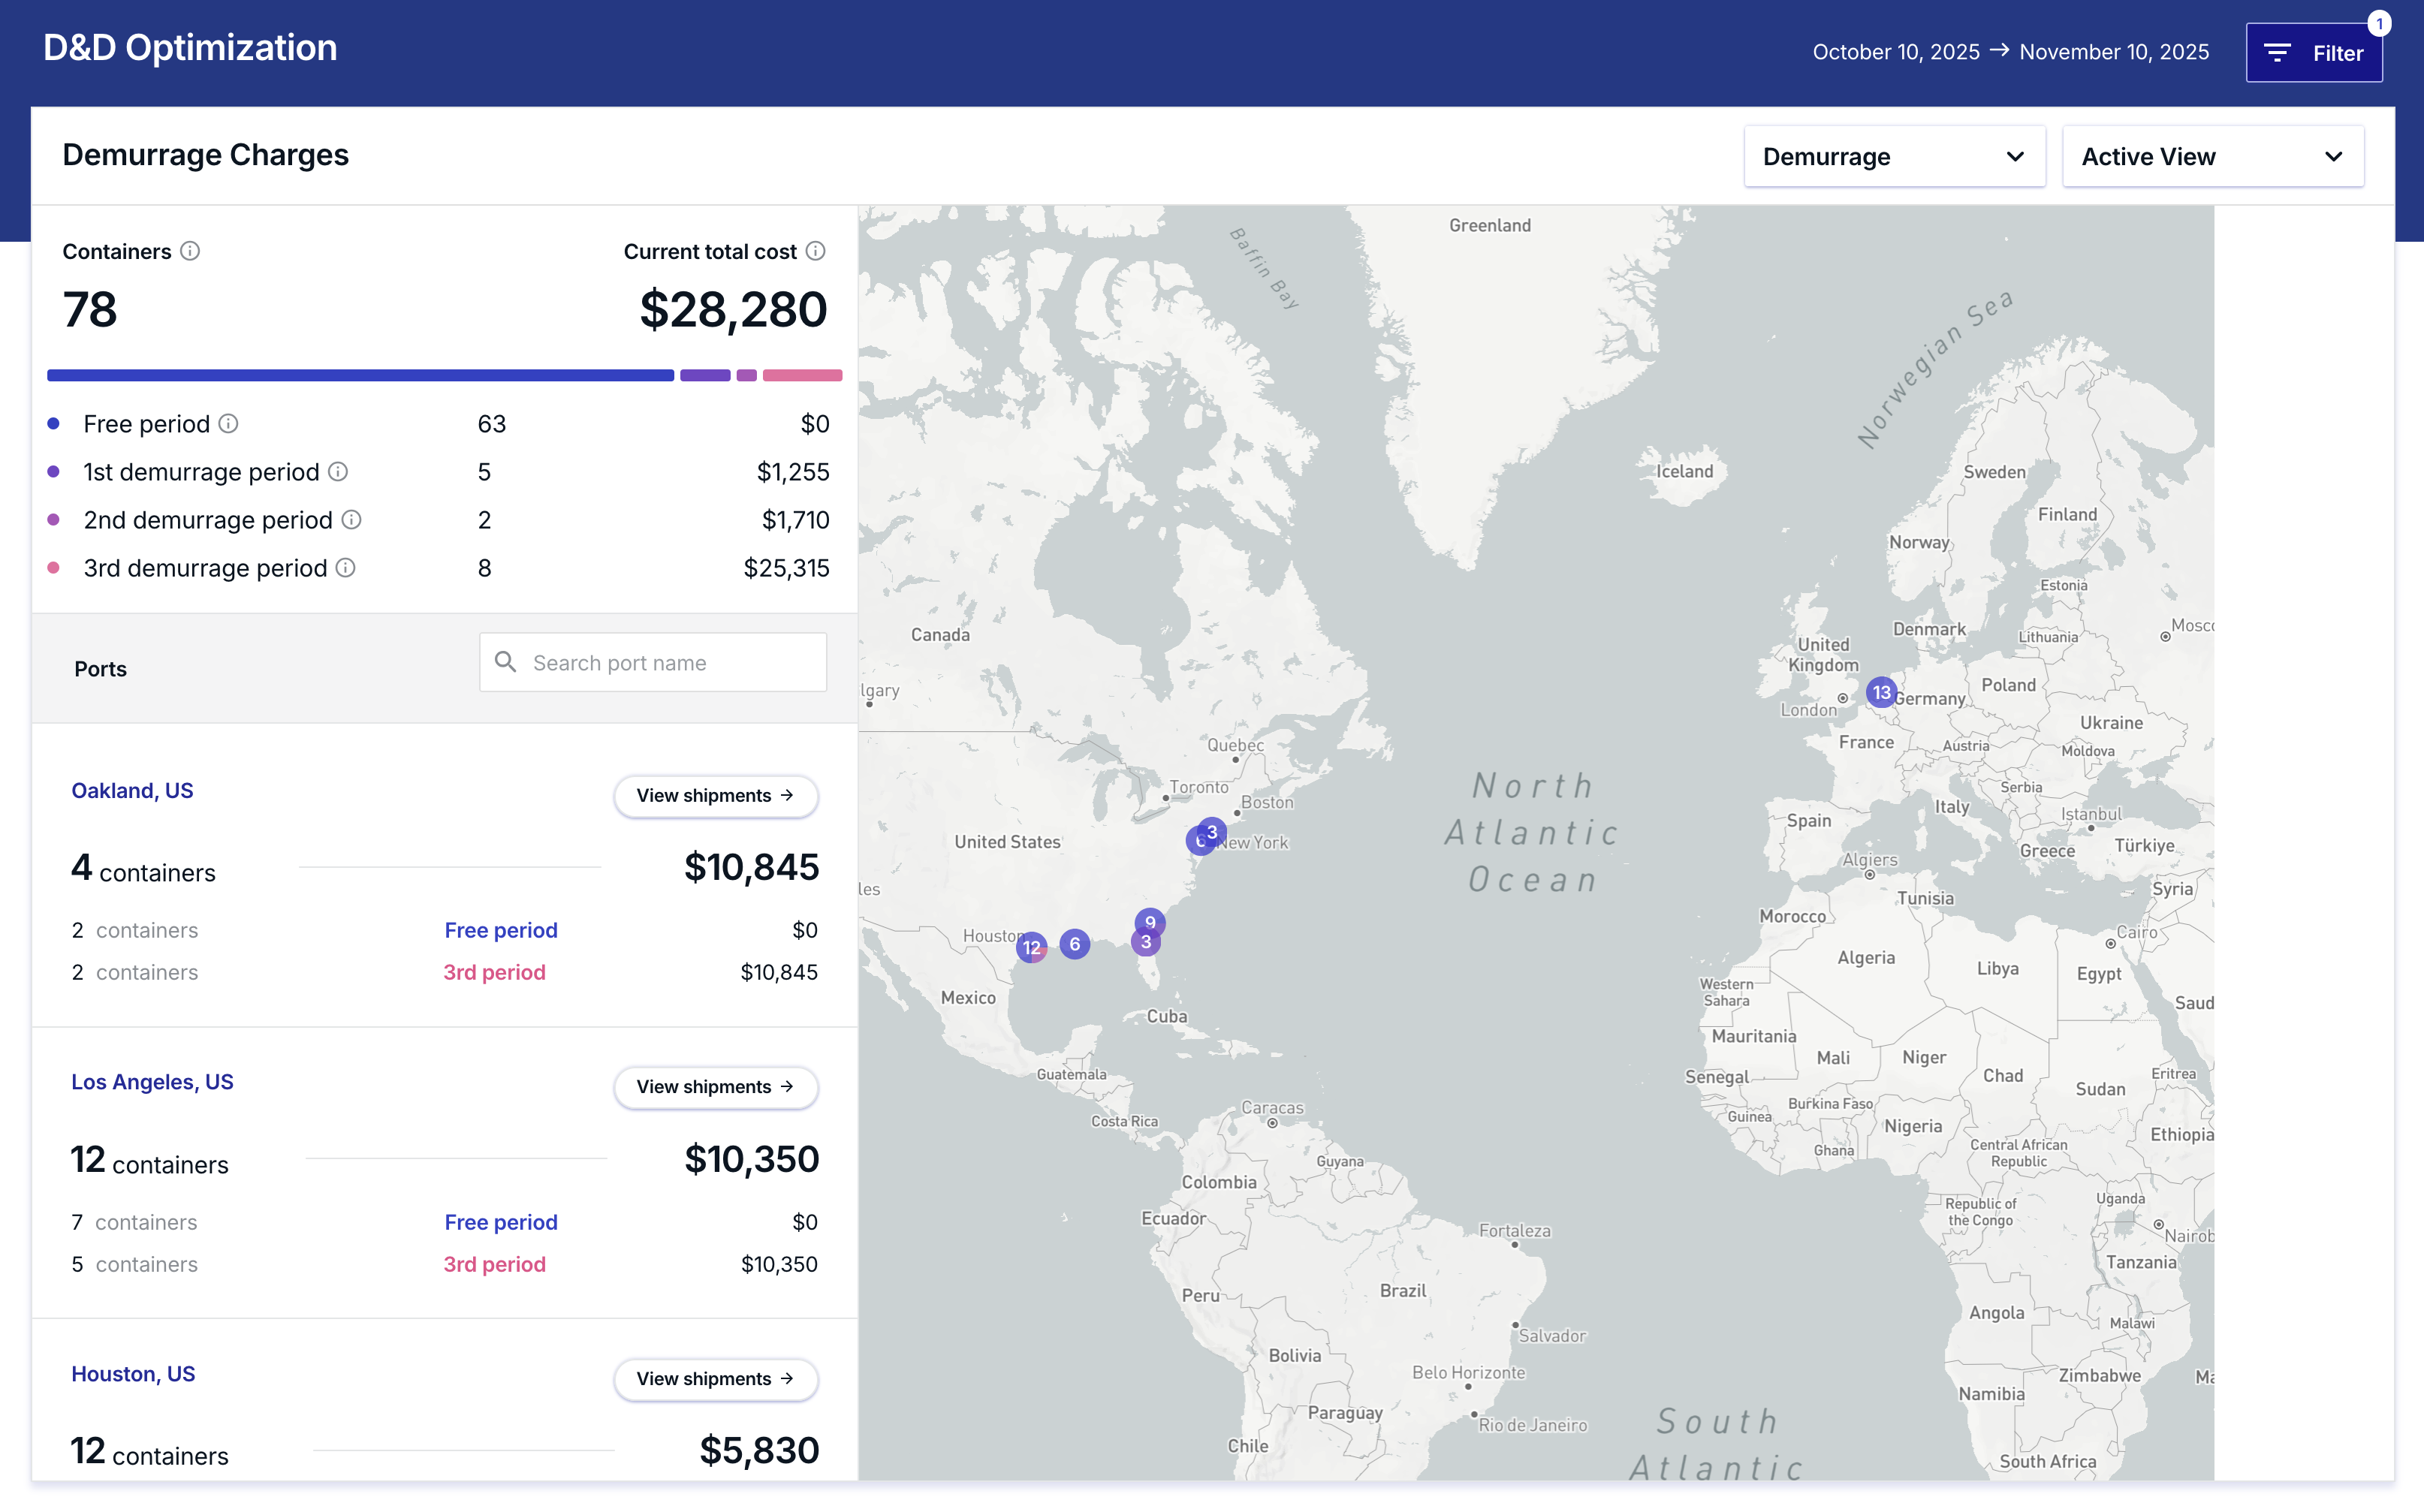
Active Demurrage Dashboard
Real-time view of current demurrage charges across all ports, showing container counts by cost periods (free, 1st, 2nd, 3rd demurrage periods) with total cost calculations and geographical distribution mapping.
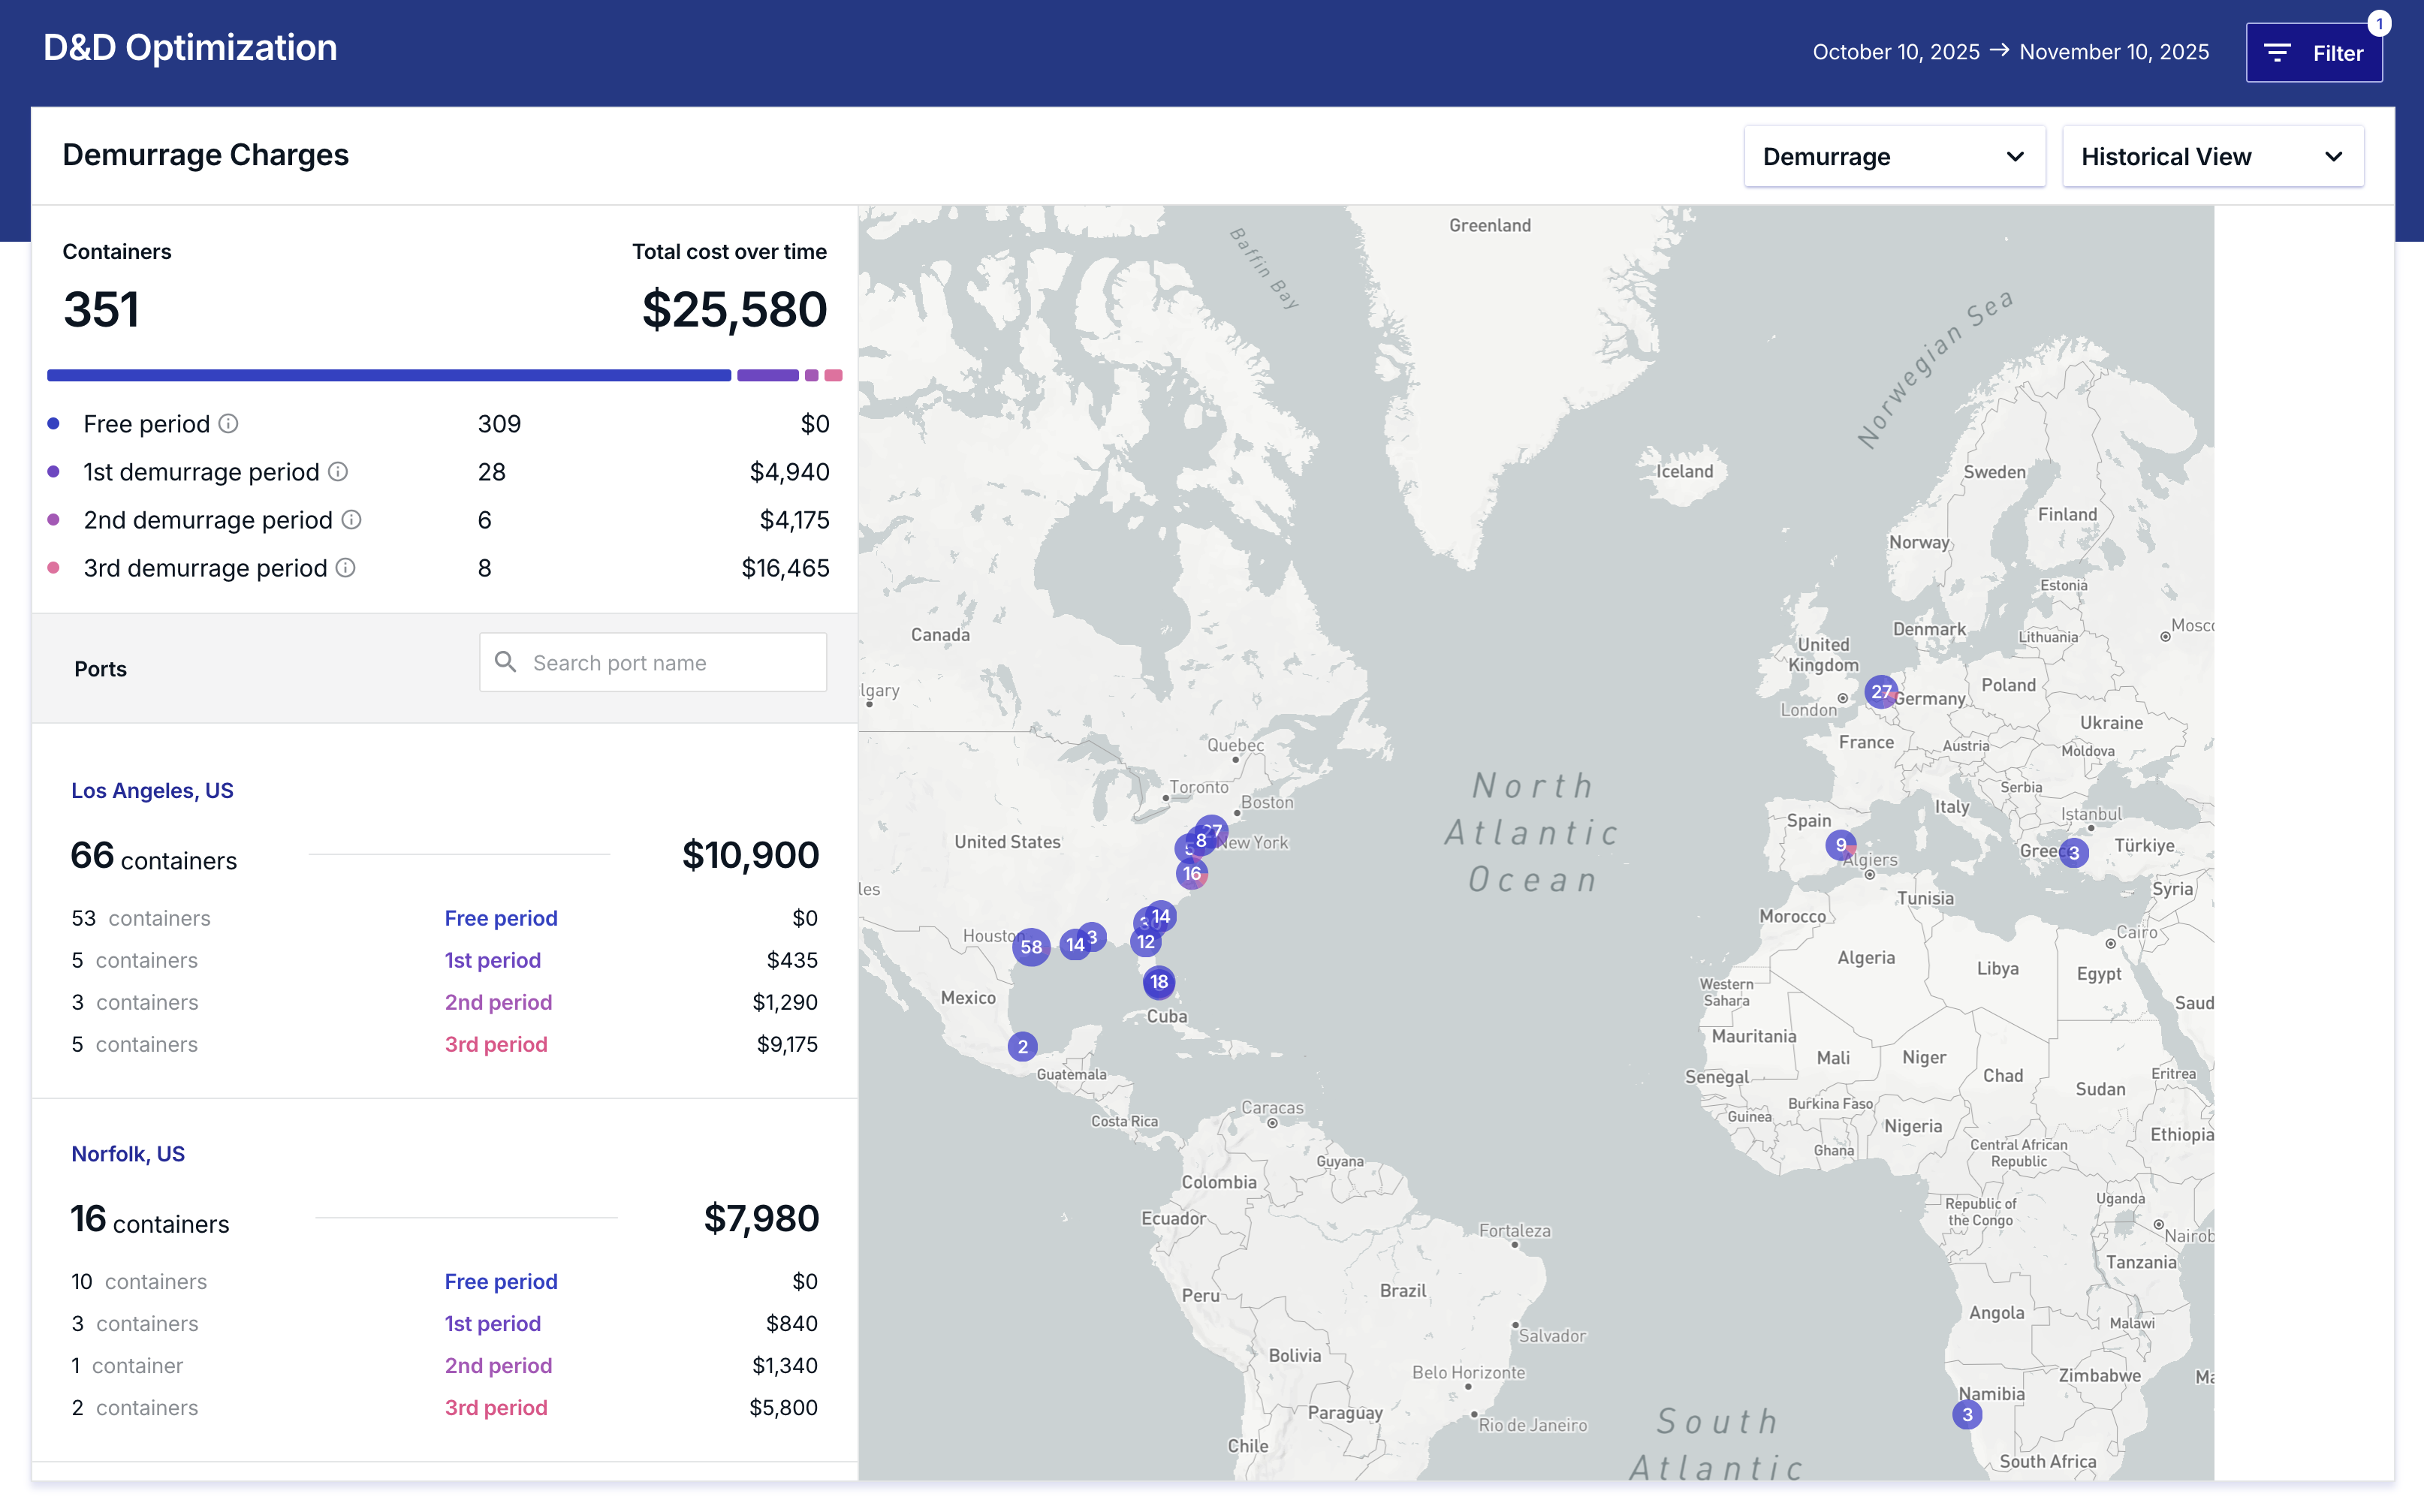
Historical Demurrage Analysis
Historical trends and patterns of demurrage costs over time, enabling strategic planning and cost optimization with expanded data sets showing total cost evolution across multiple time periods.
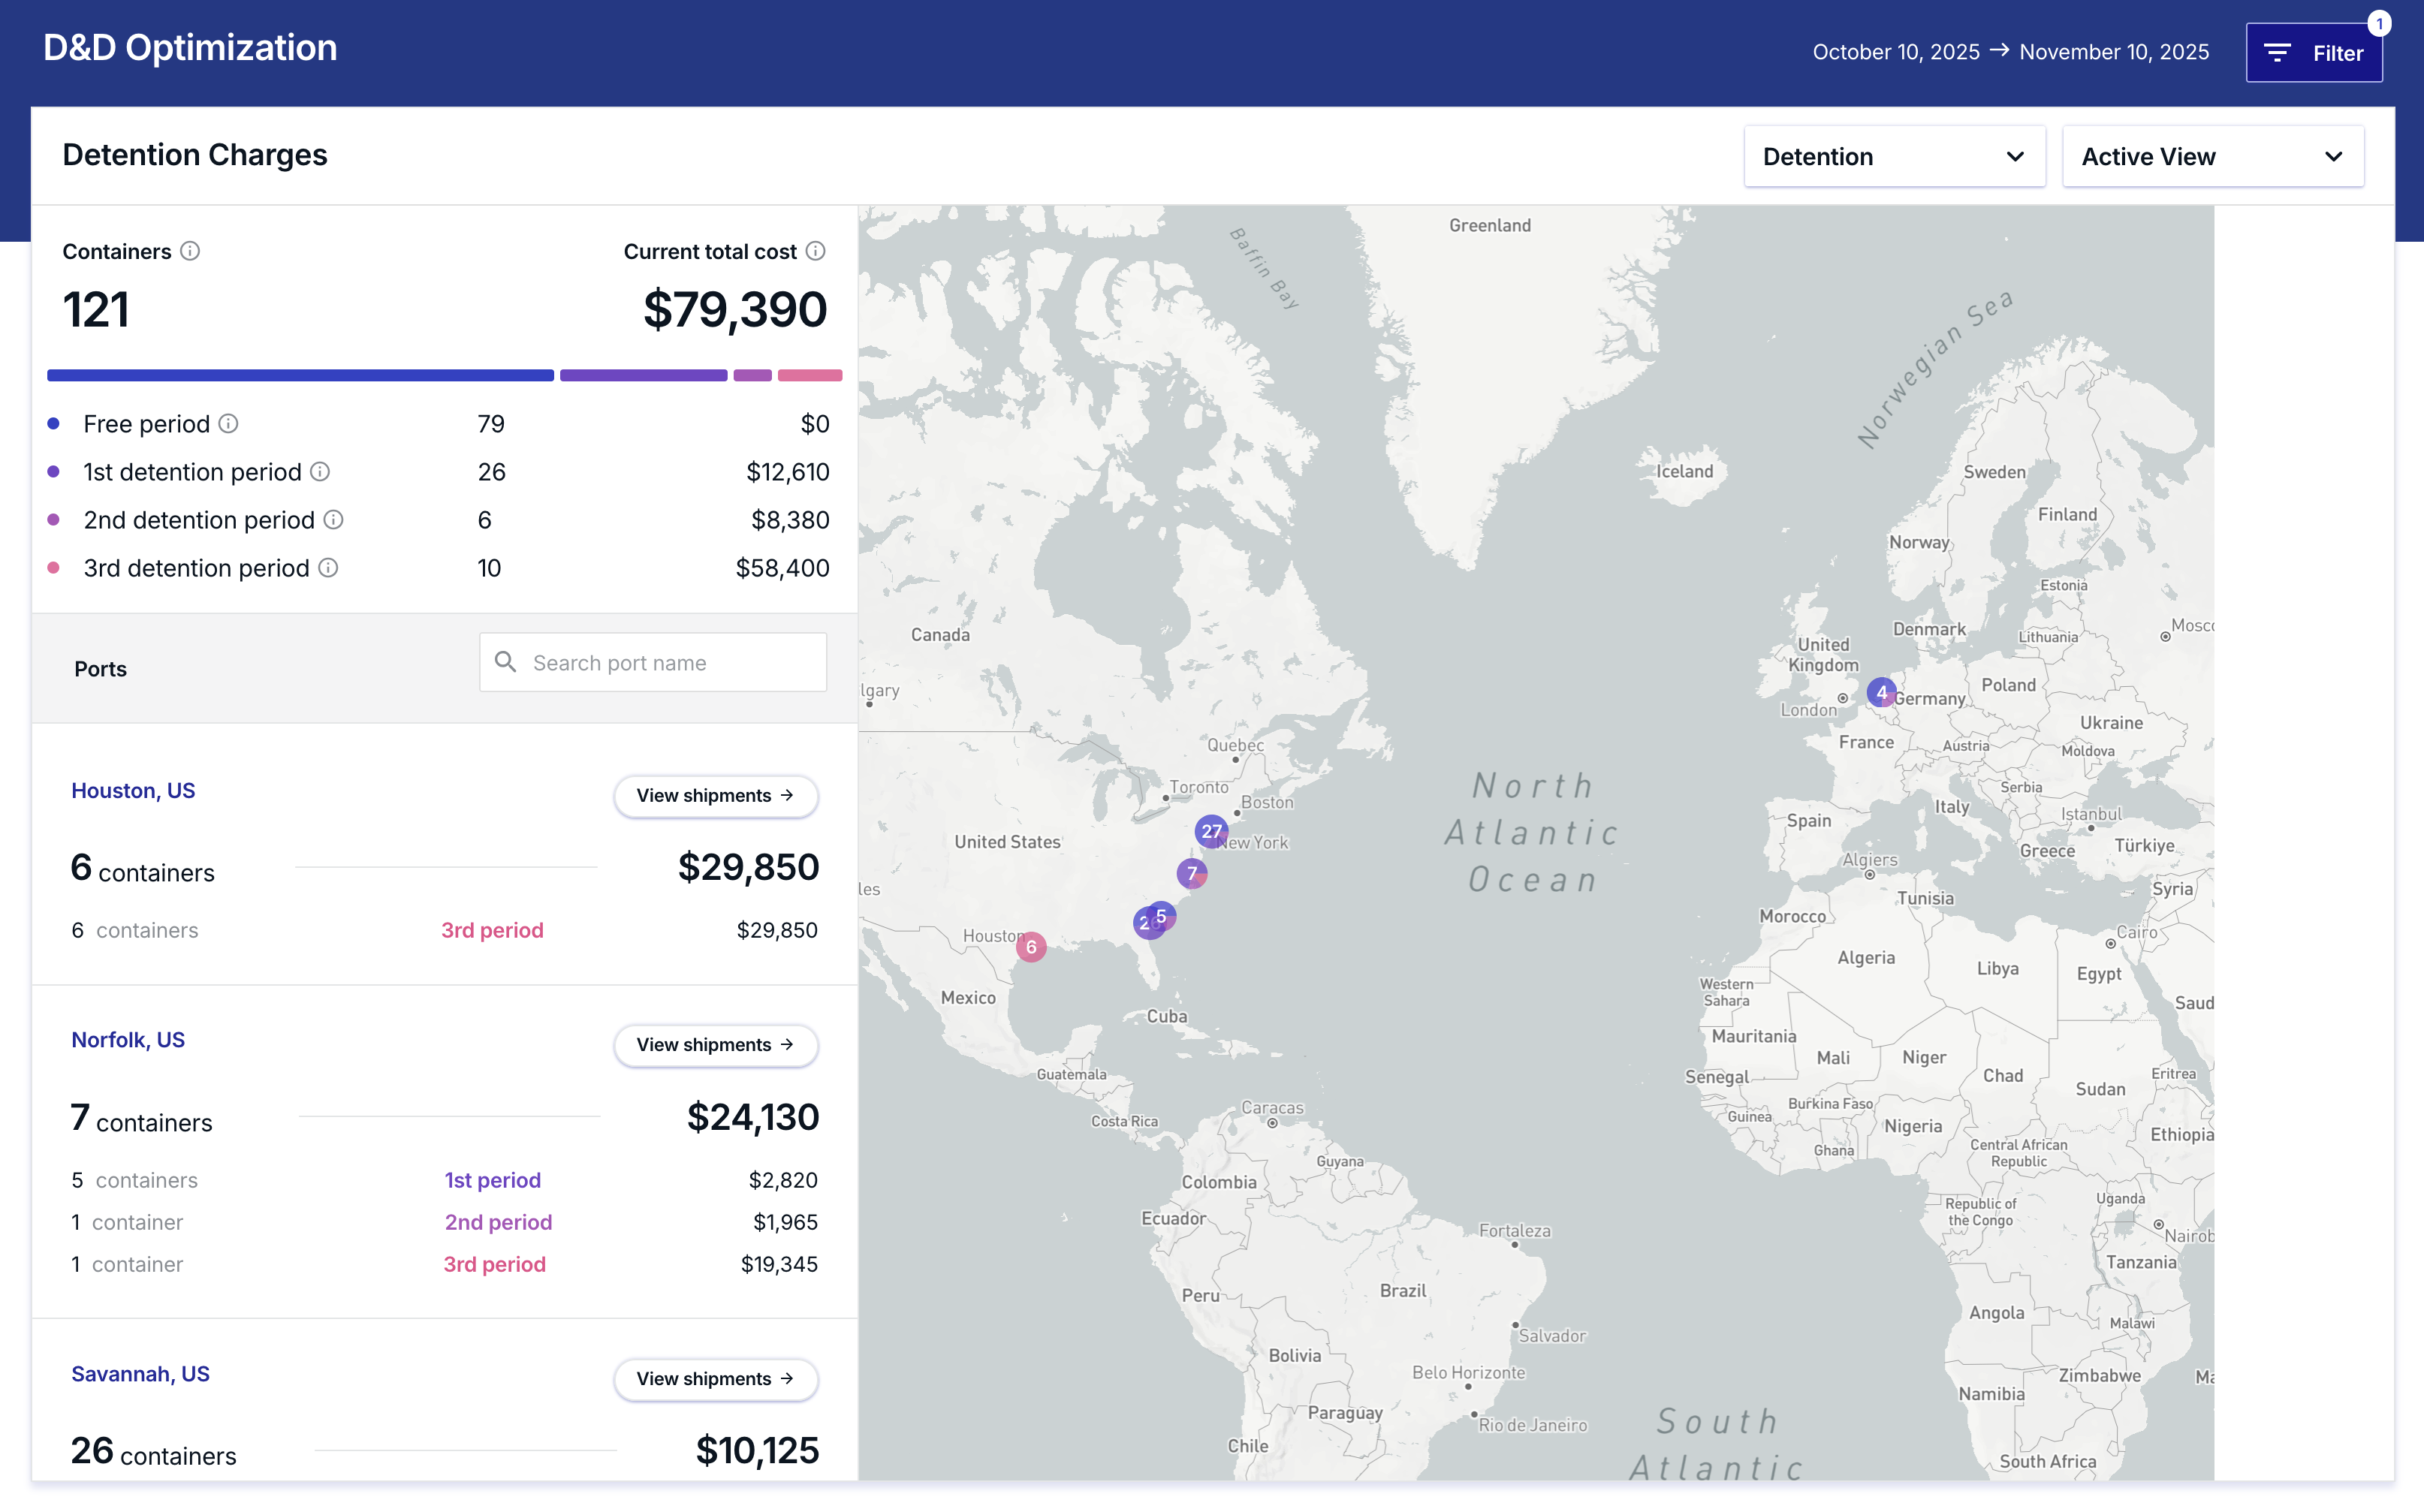
Active Detention Dashboard
Current detention cost monitoring across terminals, displaying container distribution by detention periods (free, 1st, 2nd, 3rd periods) with immediate cost impact visibility and port-level breakdowns.
Historical Detention Analysis
Long-term detention cost patterns and trends analysis, providing insights for strategic decision-making and cost reduction initiatives across multiple terminals and extended time frames.